 After a long day of meetings and other tedious manager work the perfect way to relax is to code. The best is a mini-projects where you see your results after an hour or so. I call these tasks “Plausch-Projekte” (“plah-oosh project” =”fun projects”).
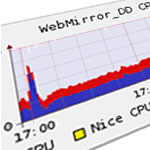
This week my plah-oosh projects were two metric tools for Ganglia. Besides Nagios Ganglia is the main monitoring tool for our cluster. We monitor something like 20 metrics like load, memory, disk usage, network activity.
Ciprian and Stefan recently built a script to monitor apache (bytes/sec, hits/sec, idle processes etc.) via the /server-status interface. Based on their work I hacked two scripts:
ganglia_mysql_metrics.php monitors multiple mysql parameters like queries/sec, slow queries/sec, threads connected:
ganglia_squid_metrics.php reports regularly about squid metrics: Requests/sec, service time, available file descriptors:
The scripts are quick and dirty code. Procedural. Not well documented. Does only read the mcast_port from the config file and ignores the rest. But it might be a good base to be used on your cluster too. Just call them every minute via the crontab.

Pingback: Ganglia rules! « David’s NEW Blog